It was time to step out of the CRUD comfort zone. A look at the architecture, the stack, and the strict "no-tutorial" mindset behind my new asynchronous health check system.
Why this project
The Problem: My GitHub was filled with nothing but simple CRUD applications.
The Search: I considered simpler projects, but I wanted a real challenge that demonstrated real infrastructure thinking, not just basic API endpoints.
The Solution: I chose the Deploy Tracker because it perfectly combines a solid backend foundation with real DevOps culture.
When looking for the right challenge to bridge the gap between Back-End Engineering and DevOps, my mentor presented three options, and together we evaluated each one.
The first suggestion was a Pomodoro Timer. Building a custom interface to track my own metrics sounded cool, but the tech stack would be identical to my last GTD app: FastAPI, SQLite, and Docker.
The second was a URL Shortener. This was definitely more challenging. The stack would be a big step up: FastAPI, PostgreSQL (a great upgrade from SQLite), Redis, Nginx, Docker Compose, GitHub Actions, and automated tests.
This was close to what I wanted, but I needed to explore DevOps culture even further. I looked at the core stack I was assembling:
FastAPI & PostgreSQL: Solid foundation and data management
Redis & Nginx: Performance and traffic management
Docker Compose: Containerization and standardized environments
GitHub Actions: CI/CD
To truly capture the DevOps mindset, I realized I needed observability tools. After some research, I decided against Kubernetes—it's too complex right now and would hinder my learning curve in college since I don't have the foundation for it yet. Instead, I chose Prometheus and Grafana.
Combining this powerful stack with the need for a real-world application, my mentor's third suggestion was the perfect fit: the Deploy Tracker.
What it does
The Deploy Tracker, it's an application that registers and monitors deploys applications. Example: If you made a Deploy of any application of yours, the Deploy Tracker show you the: Status, Logs and alerts you if something goes down.
The architecture
The whole architecture is:
FastAPI - Receive webhooks of the Deploy and Health Checks
PostgreSQL - Deploy history, status and metadata
Redis - Used to receive the task of API and send to the asynchronous worker.
Celery - The asynchronous worker! Run the health checks, sent by Redis.
Prometheus - Collect metrics! Latency, uptime, status HTTP.
Grafana - Dashboard with visual metrics
Docker Compose - Six(6) Orchestrated Containers
GitHub Actions - CI/CD with tests, builds and lint
Nginx - Reverse proxy
The roadmap
Week 1: FastAPI + PostgreSQL (API core + database)
Week 2: Redis (caching layer)
Week 3: Celery (async workers + health checks)
Week 4: Prometheus (metrics collection)
Week 5: Grafana (monitoring dashboards)
Week 6: GitHub Actions (CI/CD pipeline)
Week 7: Nginx (reverse proxy) + Docker Compose (full orchestration)
Week 8: README polish, tests, final refinements
Tool for organizing the project: I considered using Jira since we use it in college but it, had too many features for a solo project. I chose GitHub Projects with a Kanban board instead.
Curiosity about section projects in GitHub: If you write in end of a commit: closes <issue number>
The GitHub automatically close the issue. I know it's simples, but it's cool.
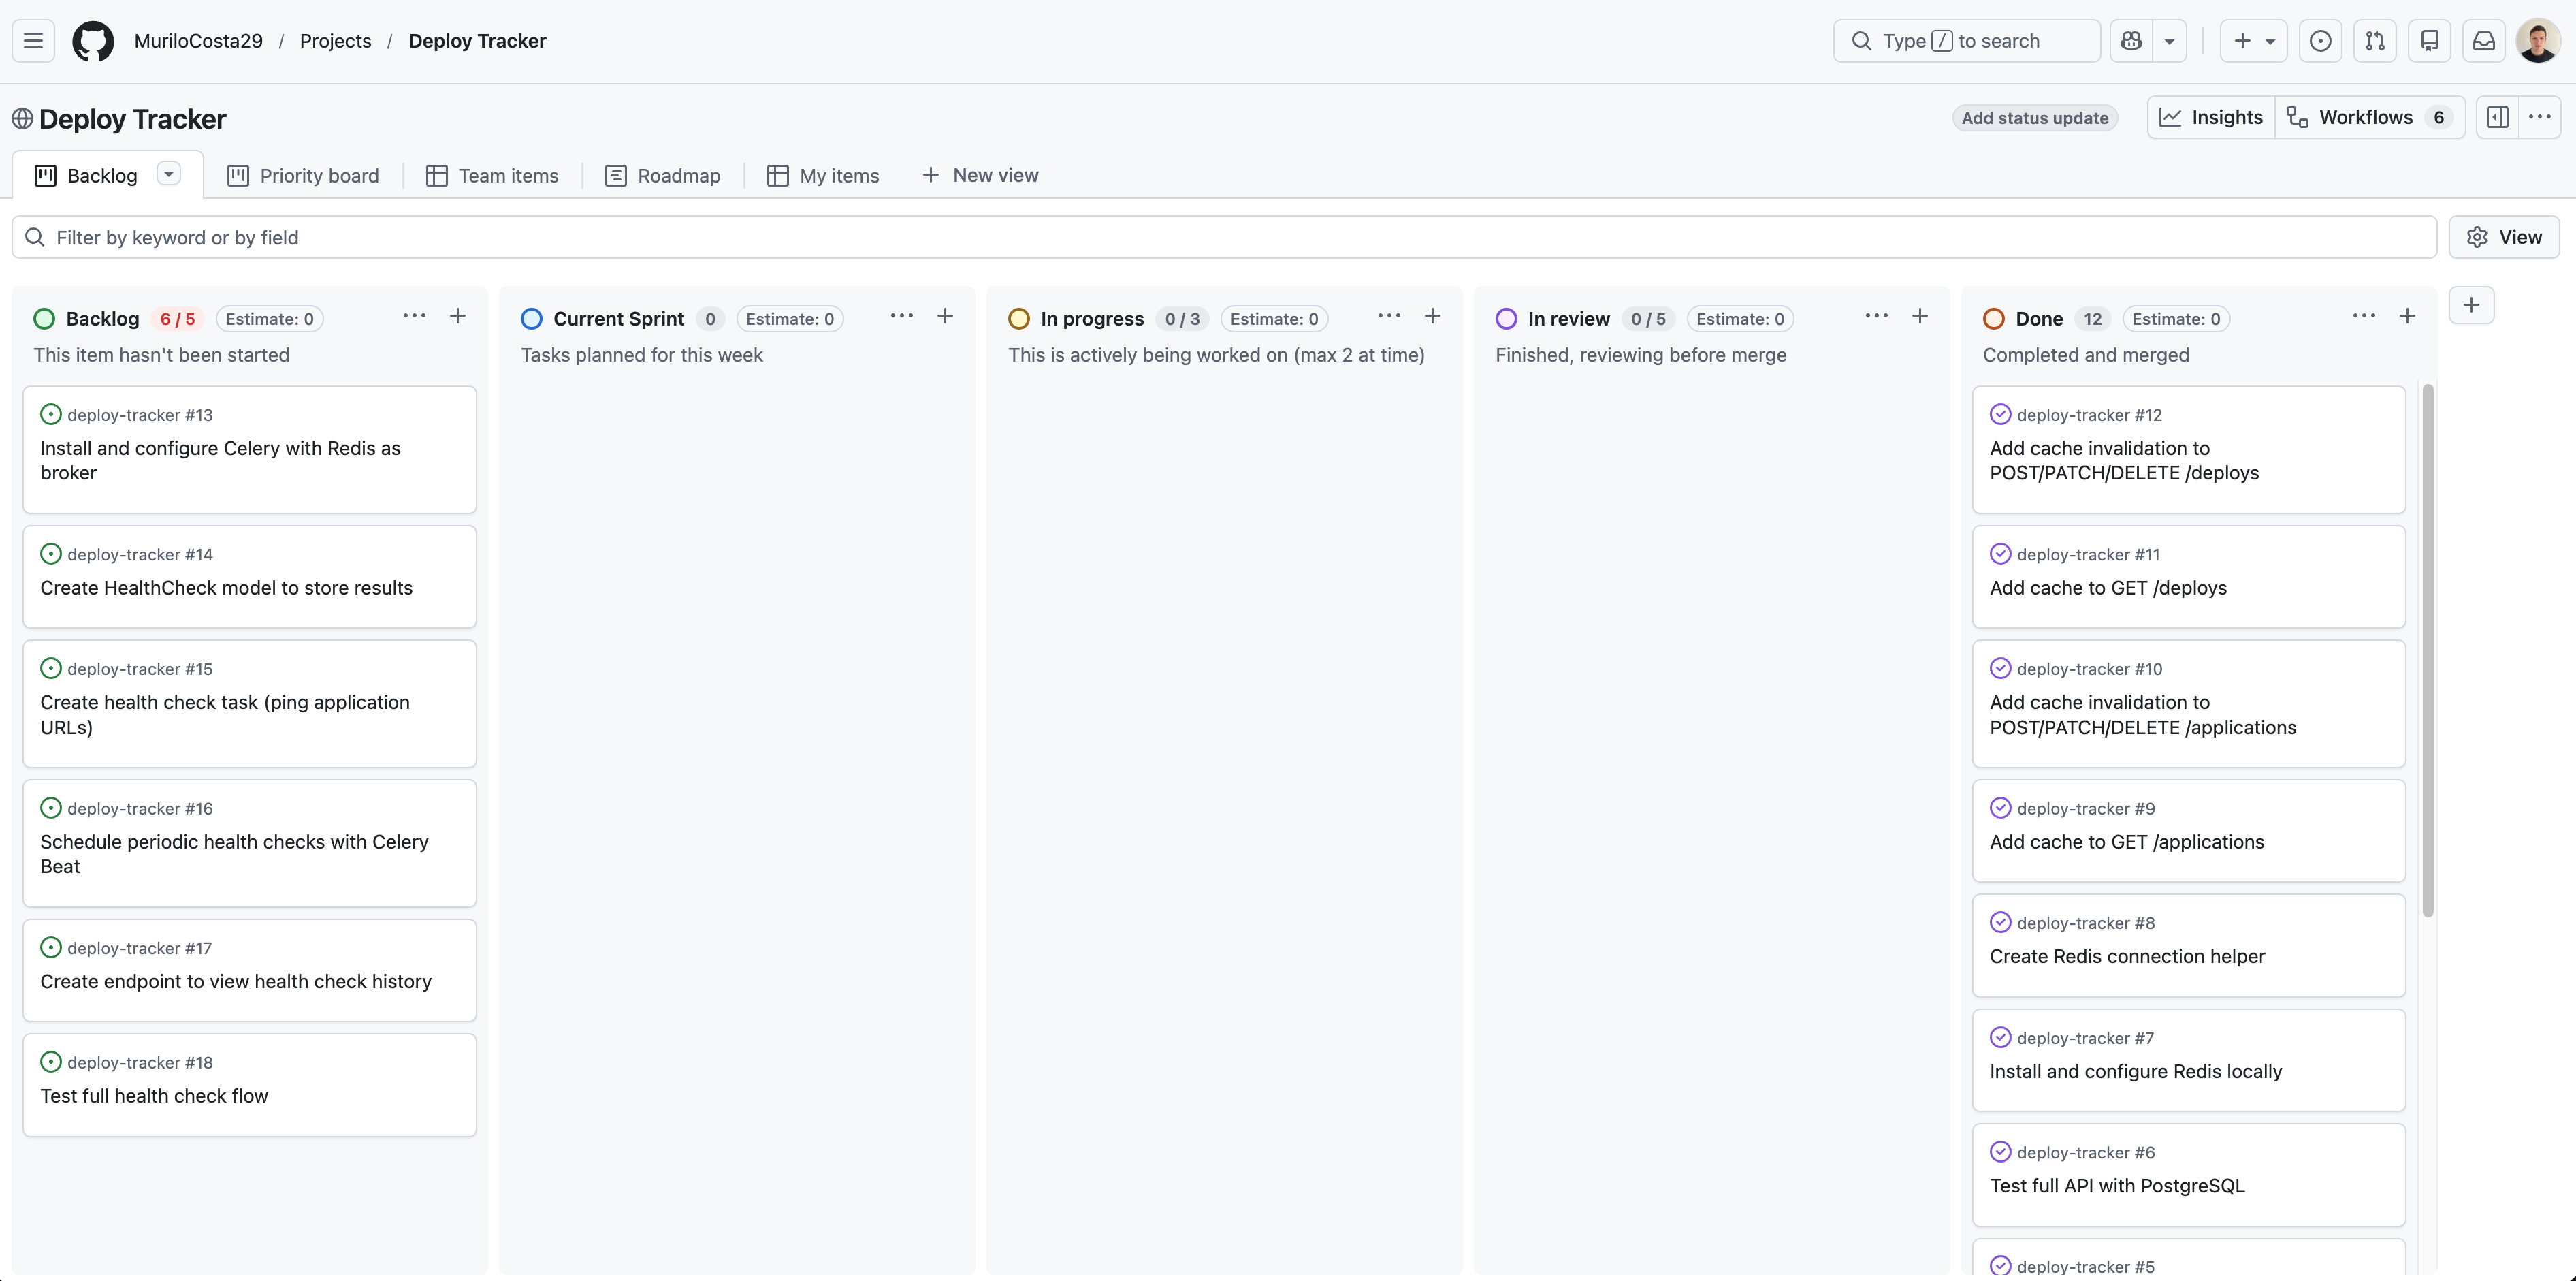
My dashboard on the day I'm writing this post. 👆
How I'm building it
The final product is important, but the engineering process behind it is my real focus. I am building the Deploy Tracker entirely without step-by-step tutorials or copy-pasting. It is a rigorous cycle of reading official documentation, implementing, failing, and trying again. The immersion has become so deep that I literally find myself dreaming about lines of code. As I navigate the early stages of the project and integrate new tools like Redis, I am realizing something profound: forcing my mind to actually write the code from scratch changes my entire perspective. It is not just about making it work; it is about truly seeing and understanding the architecture.
Rule #1
I made a strict rule for this project: no code goes into the repository unless I understand exactly how and why it works. This approach has completely changed how I solve problems. Previously, I had only heard of Stack Overflow in passing; now, alongside official documentation, it has become an essential research tool for understanding complex technical discussions and debugging real-world errors.
Rule #2
A Tool, Not a Crutch
I actively use AI, but strictly as an educational mentor. I use it to explain how tools work under the hood or to clarify complex concepts, but never to write the code for me. The goal is to build a solid foundation, not to bypass the learning curve.